Discover how to debug your automations in Aquarium
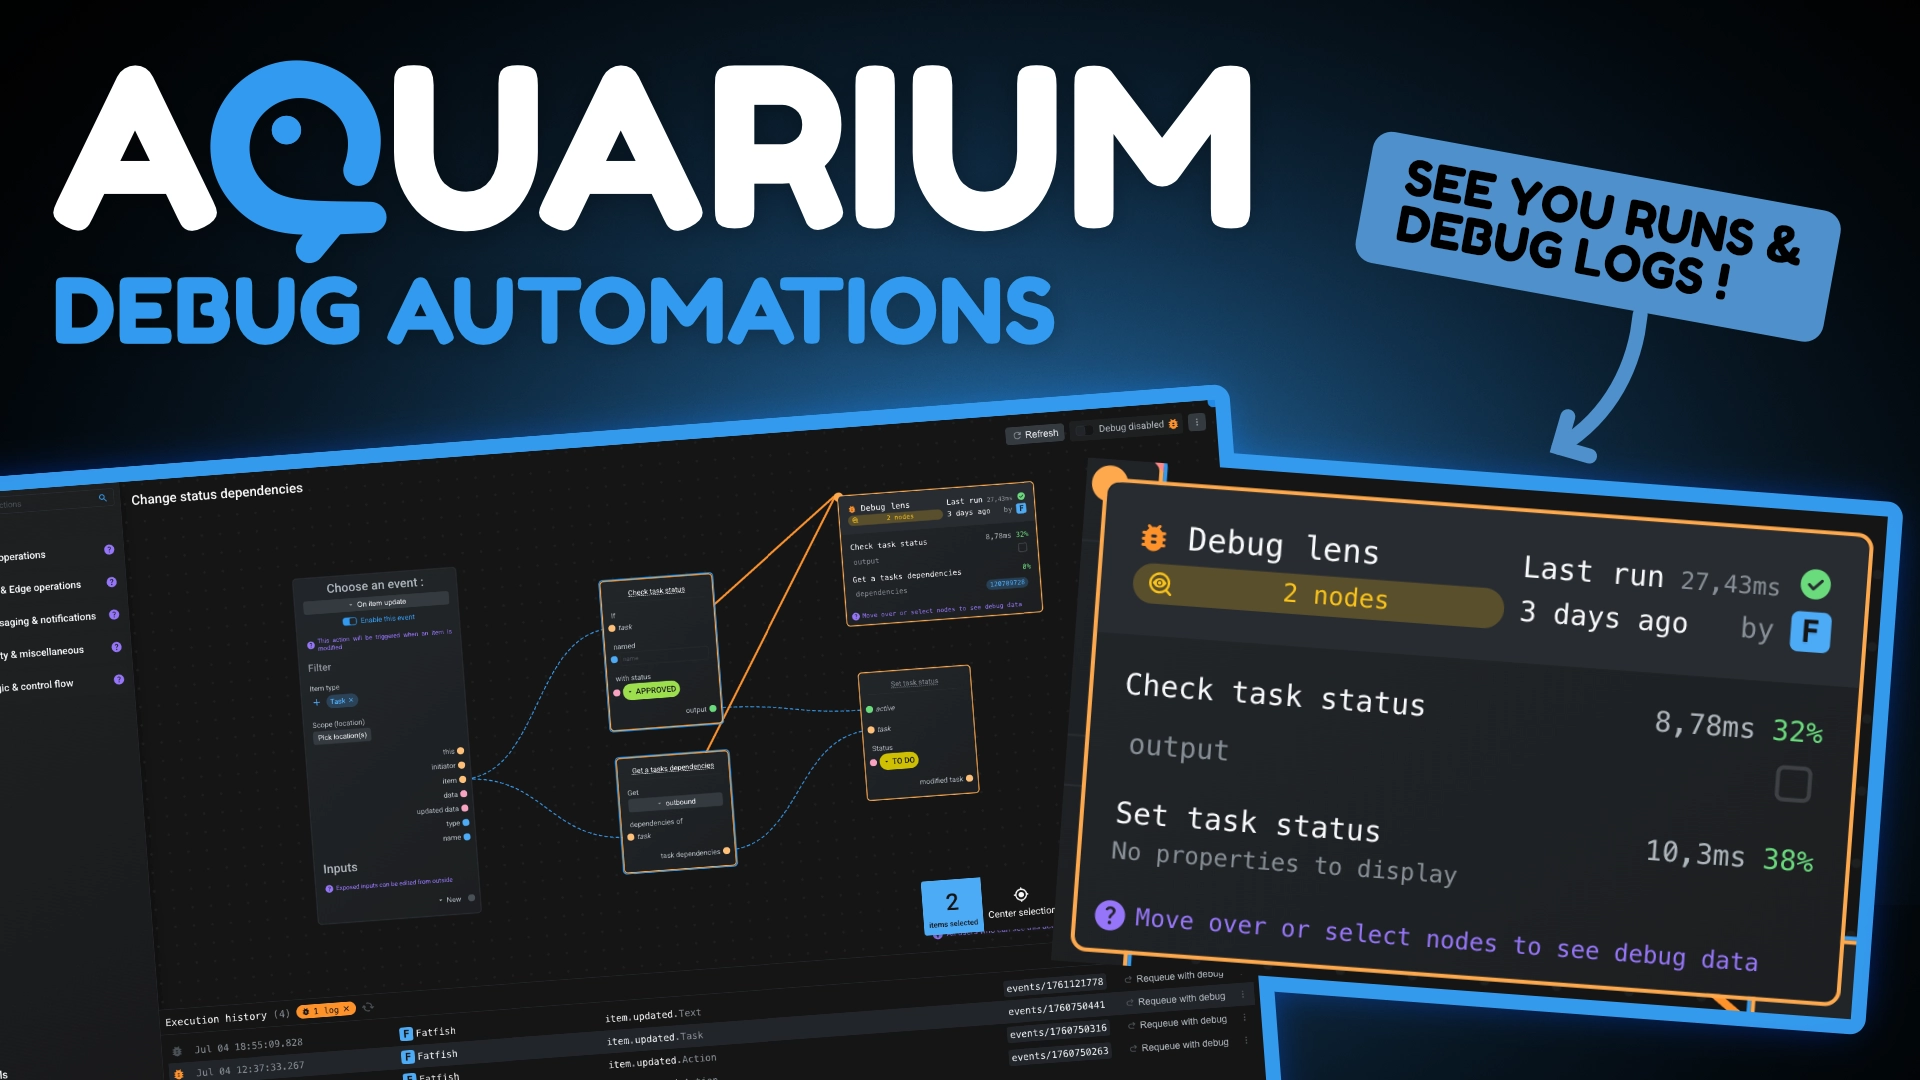
Aquarium provide a powerful automation system, called Actions, using our nodal system. And it's now easier than ever to debug them! Identify nodes that cause errors, when does the execution stop, and more.
The actions system allows you to create complex workflows, in a nodal visual interface without having to run an external server or service. You can trigger actions based on Aquarium's events, or manually from the UI or API. These actions can be used to automate task status changes, send notifications, or even trigger pipeline processes.
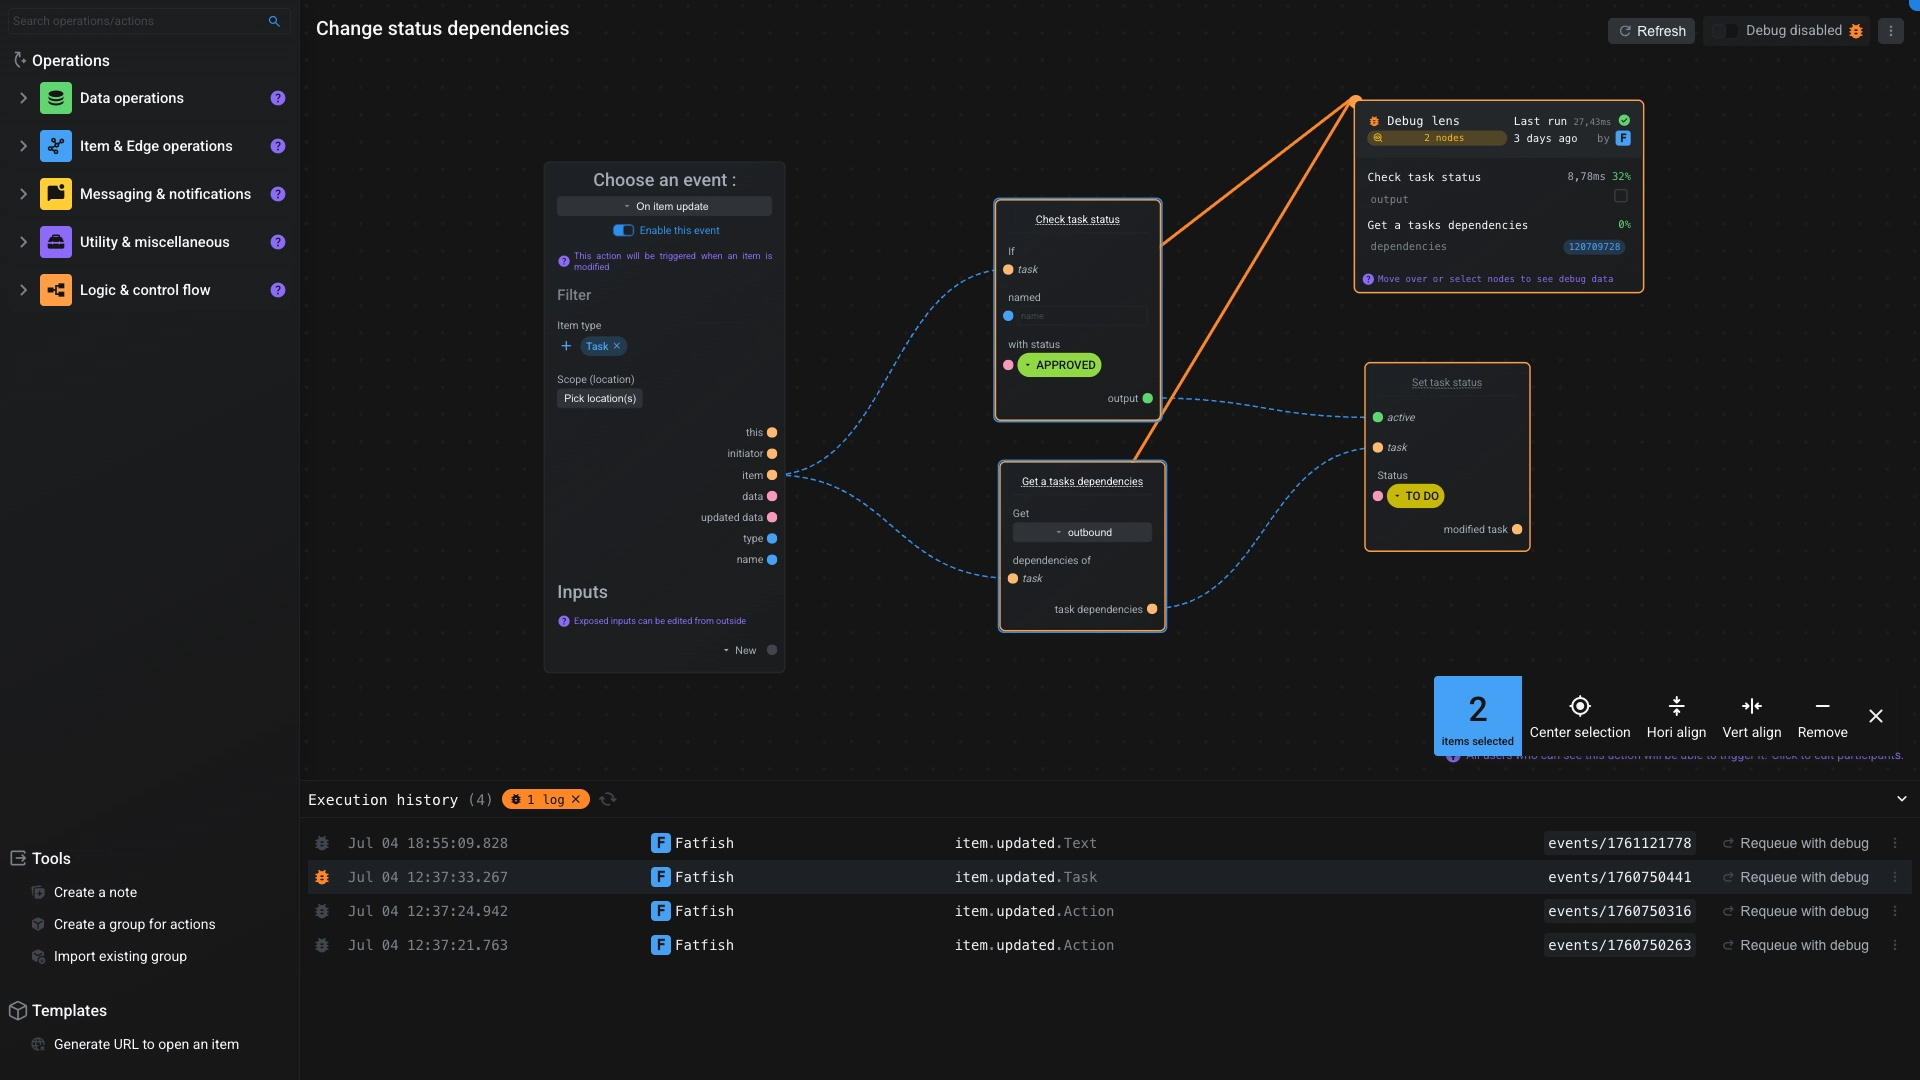
With the latest update, you can now enable debug mode on specific actions. The debug logs grant you insights into the execution:
- Execution time: See how long the global action takes, and how many times each node took.
- Error messages: If an error occurs, the debug logs will show you the node that caused the error, and the error message. It also shows you what nodes have already been executed before the error occurred.
- Nodes outputs: For each node, you can see the outputs that were generated during the execution, which is perfect for ensuring that the data is correct and as expected.
From the action editor page, you can also visualize the execution history with previous runs and logs. This allows you to track changes, identify issues, and understand how your actions have evolved over time. Select a previous run, and re-execute it with debug mode enabled to see how it behaves with the current configuration. This is particularly useful for testing and refining your automations.
In addition, we have also reworked the interface, especially the sidebar where the available nodes are listed.