Performance observer & metrics with Grafana support 🚀
When using a tool like Aquarium in your production environment, it's critical that the software runs at full speed and without interruption. At times, software can act as a "black box" where you can't see what's happening backstage.
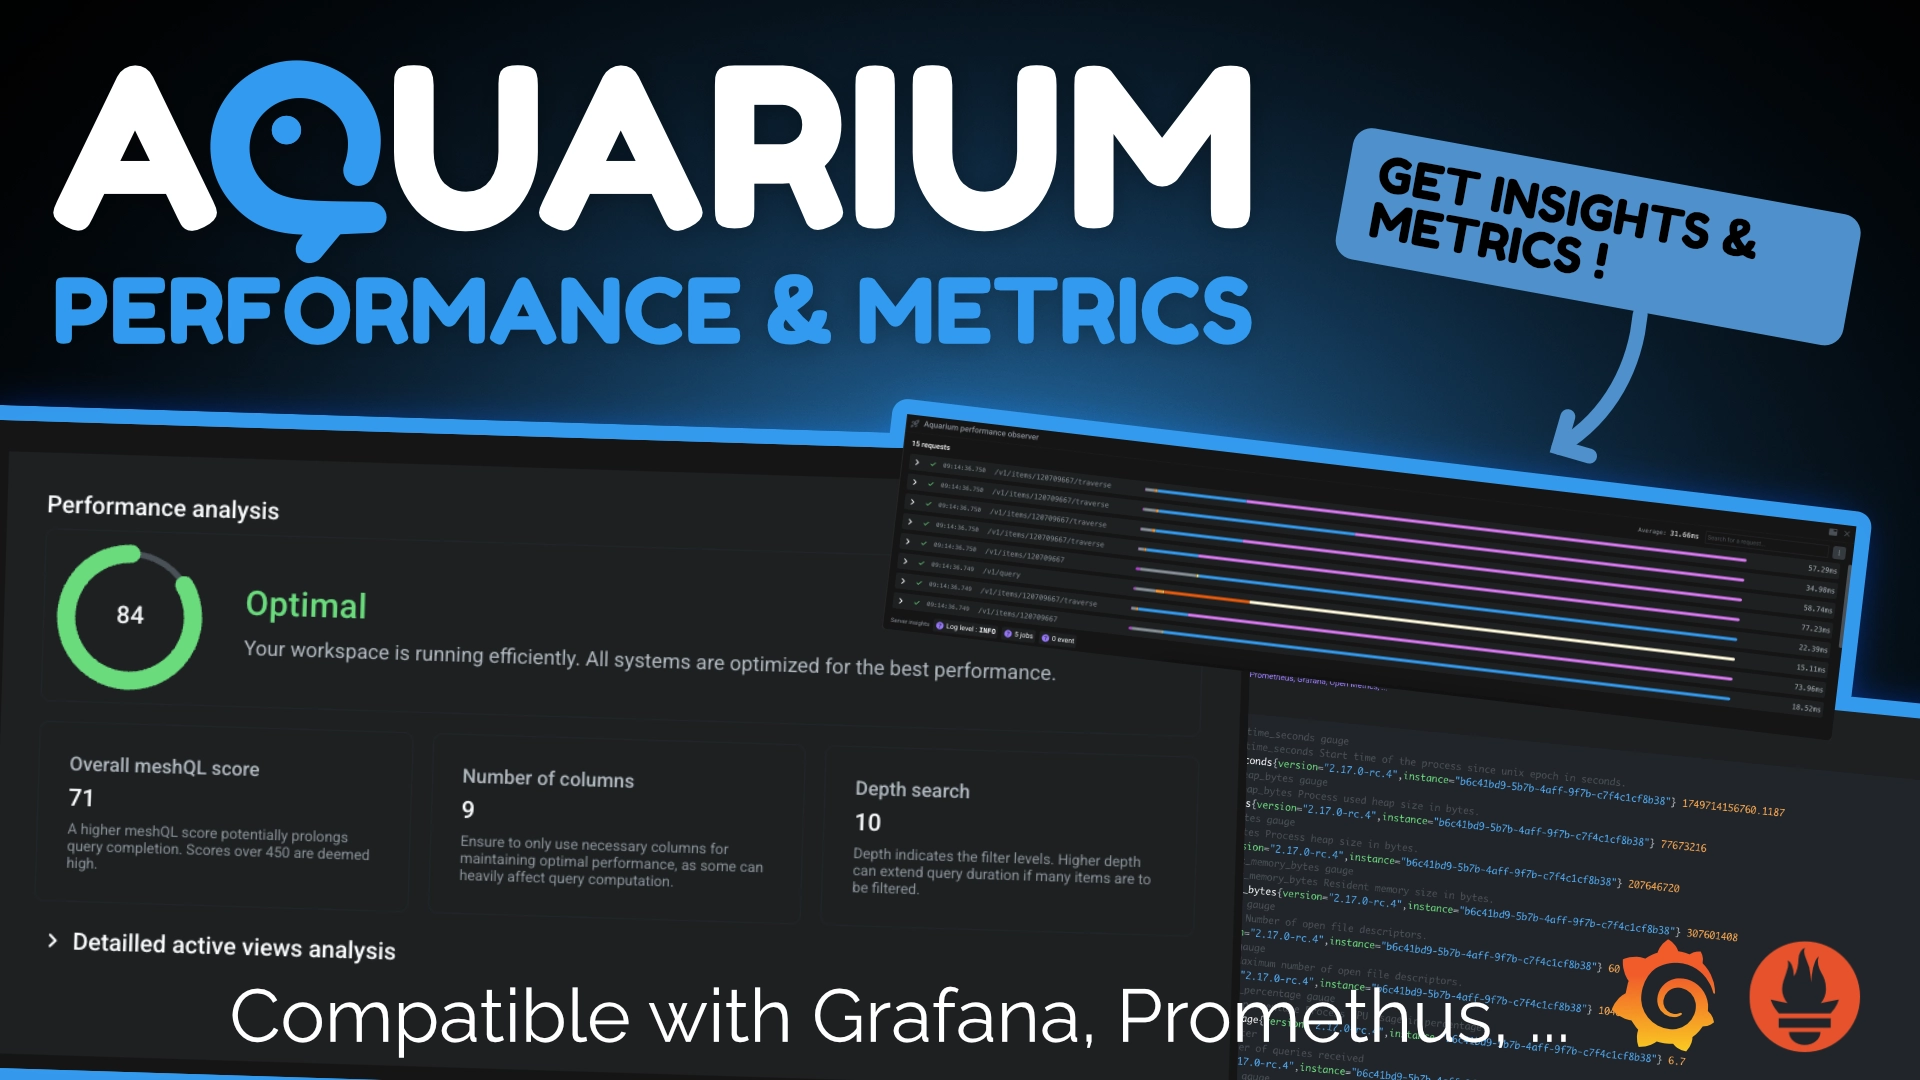
In the latest release, at Fatfish Lab, we integrated a range of tools to provide insights and metrics:
- ⚡️ Performance observer: Know exactly the request time of all queries that Aquarium sends and receives! Each query is detailed enough so you can visualize the duration of each step the server is taking to handle your request. It's great information to see how fast Aquarium is resolving your queries and visualizing the internal steps.
- 💯 Workspace score: We are able to calculate a performance score for your workspace. You can know if a table is optimized or not, and if you need to optimize it, you have the data to focus your efforts on tweaking your filters.
- 🧮 Metrics: Aquarium is now also compatible with #OpenMetrics! The standard used to connect with tools like Grafana, Prometheus, and many more. Metrics grant you access to specific Aquarium metrics to visualize the server load, how many requests the server handles, how many background processes are running, etc.
All this information is very useful for your team and also for our support, assisting you with all the necessary information.
Check out our video to see more!